Objective:
For calibration and validation, satellite products are often compared
against in situ measurements. Over time, the satellite-measured data
drift due to sensor degradation, resulting in errors of unknown
magnitude: comparison against ground truth data allows the satellite
sensor to be recalibrated. This process is known as vicarious
calibration because pre-launch sensor calibration information can be
adjusted once the complete system is operational in space. It is an
essential component for any long-term satellite operation in order to
ensure optimal accuracy in the satellite-derived products. We have
developed an automated, continuous vicarious calibration system for
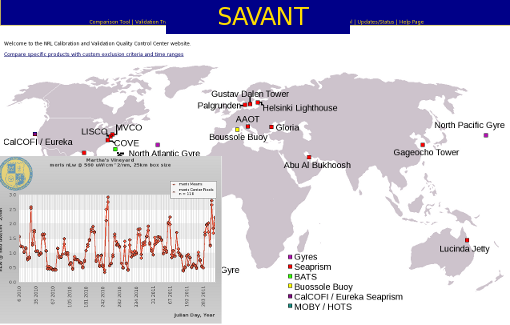
satellite ocean color sensors that employs a website interface to extract and visualize both satellite and in situ data. The data are graphed over time to allow instant visual comparison between the satellite sensor and the in situ data points and to help detect trends (drift) in the satellite measurements. In this case, we are using the NASA Aeronet-OC sites, including those in the Northern Adriatic, Martha's Vineyard, and the Gulf of Mexico. In addition, we
are using multiple satellite resolutions to assess within pixel variation to allow further fine-tuning of the calibration factors and a better understanding of how the remote sensing data relates to the in situ truth. Various products are analyzed in the comparisons including the water-leaving radiance, remote sensing reflectance, chlorophyll concentration, and absorption, scattering, and backscattering coefficients. Because of the signal loss to atmosphere and water absorption of light with remote sensing, we consider two box sizes around the center satellite pixel that covers the Aeronet sites: a five-by-five box and a three-by-three box. Upon ingestion into our database various statistics are compiled on the data, including the standard deviation within the box, the mean, and the minimum and maximum values. These are used to generate error bars both spatially and temporally and detect outliers. With these statistics compiled daily and graphed in a time series format at daily, monthly, and yearly intervals, we are better able to understand sensors degradation through time and the impact on data retrievals; deviations between sensor-derived values and in situ measurements; the impact of varying sensor resolutions; and intercomparison of multiple sensors.
SAVANT