Forming a Continuous Time Series in the Gulf of Mexico for Years 1990-2020 |
|||
The plots below were created to aid in the process of building continuous time series of model data in the Gulf of Mexico for the years 1990-2020 for baselines experiments forced with NAVGEM, but under different HPC platforms and slightly modified parameters. The experiments and time spans in question are 50.1 and 31.0 for the year of 2012, 31.0 and 32.5 for May-July 2014, and 32.5 and 90.1 for January-March 2019. Sea surface plots have been created for visual comparisons as well as domain averaged time series to make quantitative comparisons. Plots have been created for the primary circulation variables of temperaure, salinity, sea surface heigh, water U, and water V. |
|||
|
|||
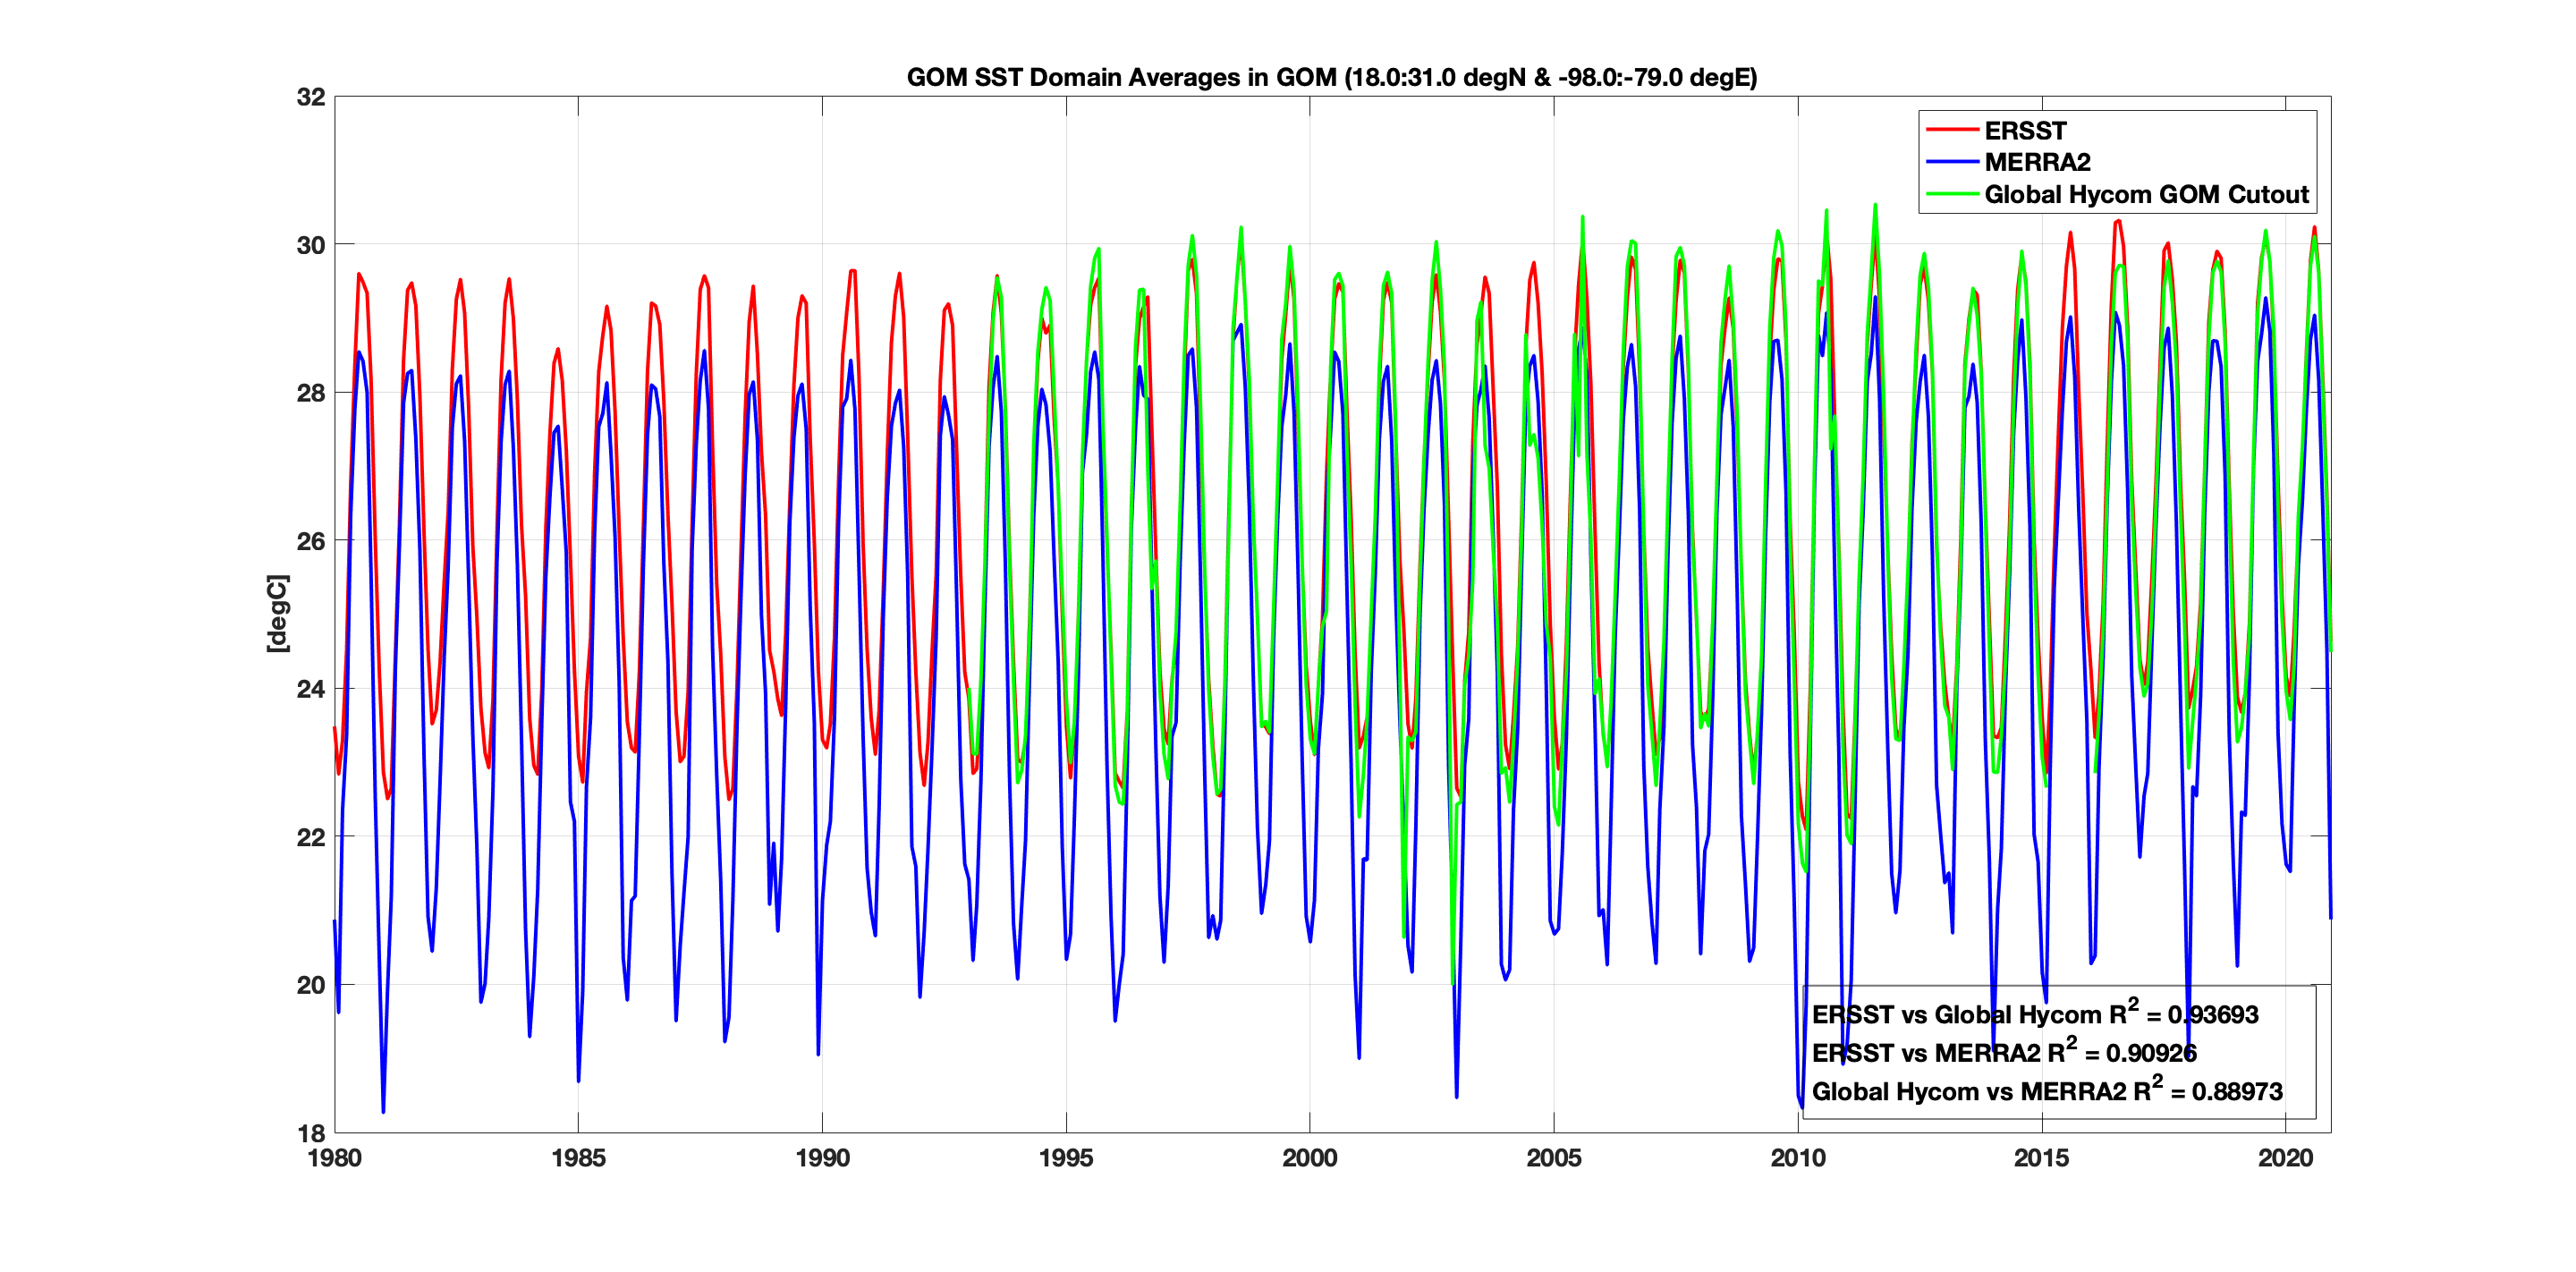
Comparing ERSST, MERRA2, and Global Hycom in GOM for Years 1980-2020 |
|||
The plots below were created to help compare SST data in the GOM for years 1980-2020 comping from various sources such as Extended Reconstructed Sea Surface Temperature (ERSST), the Global Hybrid Coordinate Ocean Model (Global Hycom), and Modern-Era Retrospective analysis for Research and Applications, Version 2 (MERRA2). Other sources will likely be added as well. These aid in understanding how well the sources compare allowing for a better knowledge of how well models are performing in comparison to observational and other model data. These plots include domain averaged time series plots from monthly means as well as seasonal surface plots. |
|||
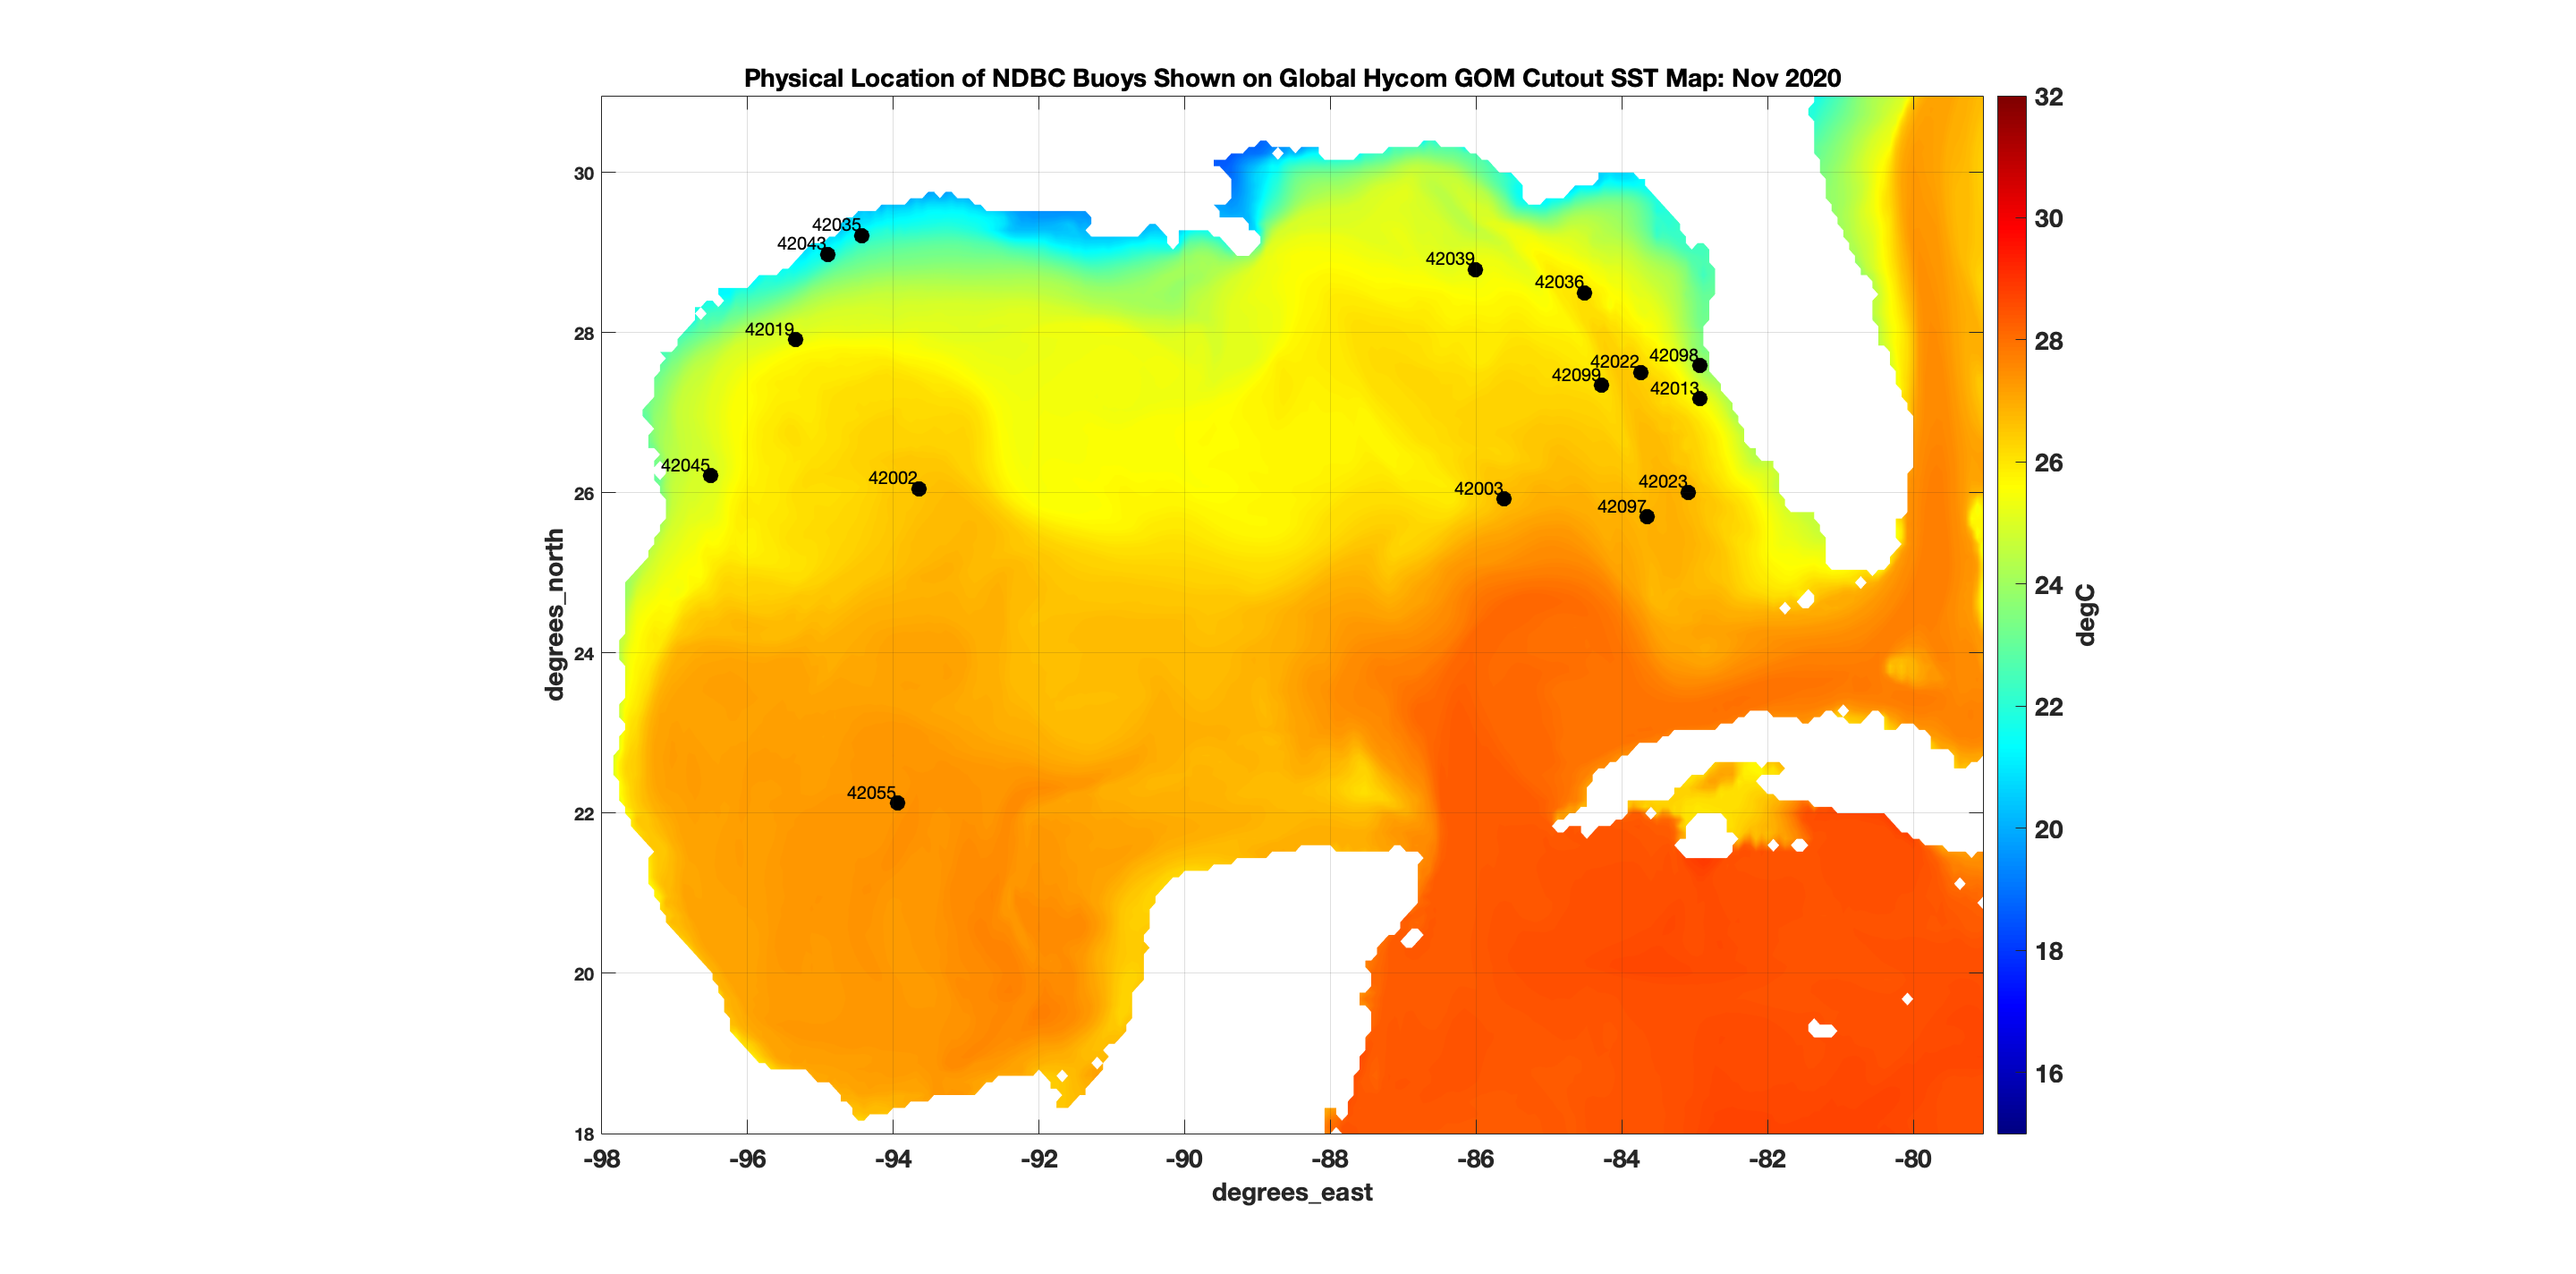
Comparing NDBC, ERSST, MERRA2, and Global Hycom in GOM for Years 1980-2020 |
|||
The plots below were created to help compare SST data in the GOM for years 1980-2020 comping from various sources such as the Extended Reconstructed Sea Surface Temperature (ERSST), observational data from the National Data Buoy Center (NDBC), the Global Hybrid Coordinate Ocean Model (Global Hycom), and Modern-Era Retrospective analysis for Research and Applications, Version 2 (MERRA2). These aid in understanding how well the sources compare allowing for a better knowledge of how well models are performing in comparison to observational and other model data. These plots include interpolated time series plots from monthly means as well as seasonal surface plots. There is also a reference plots to understand where the buoys are located. |
|||
|
|||
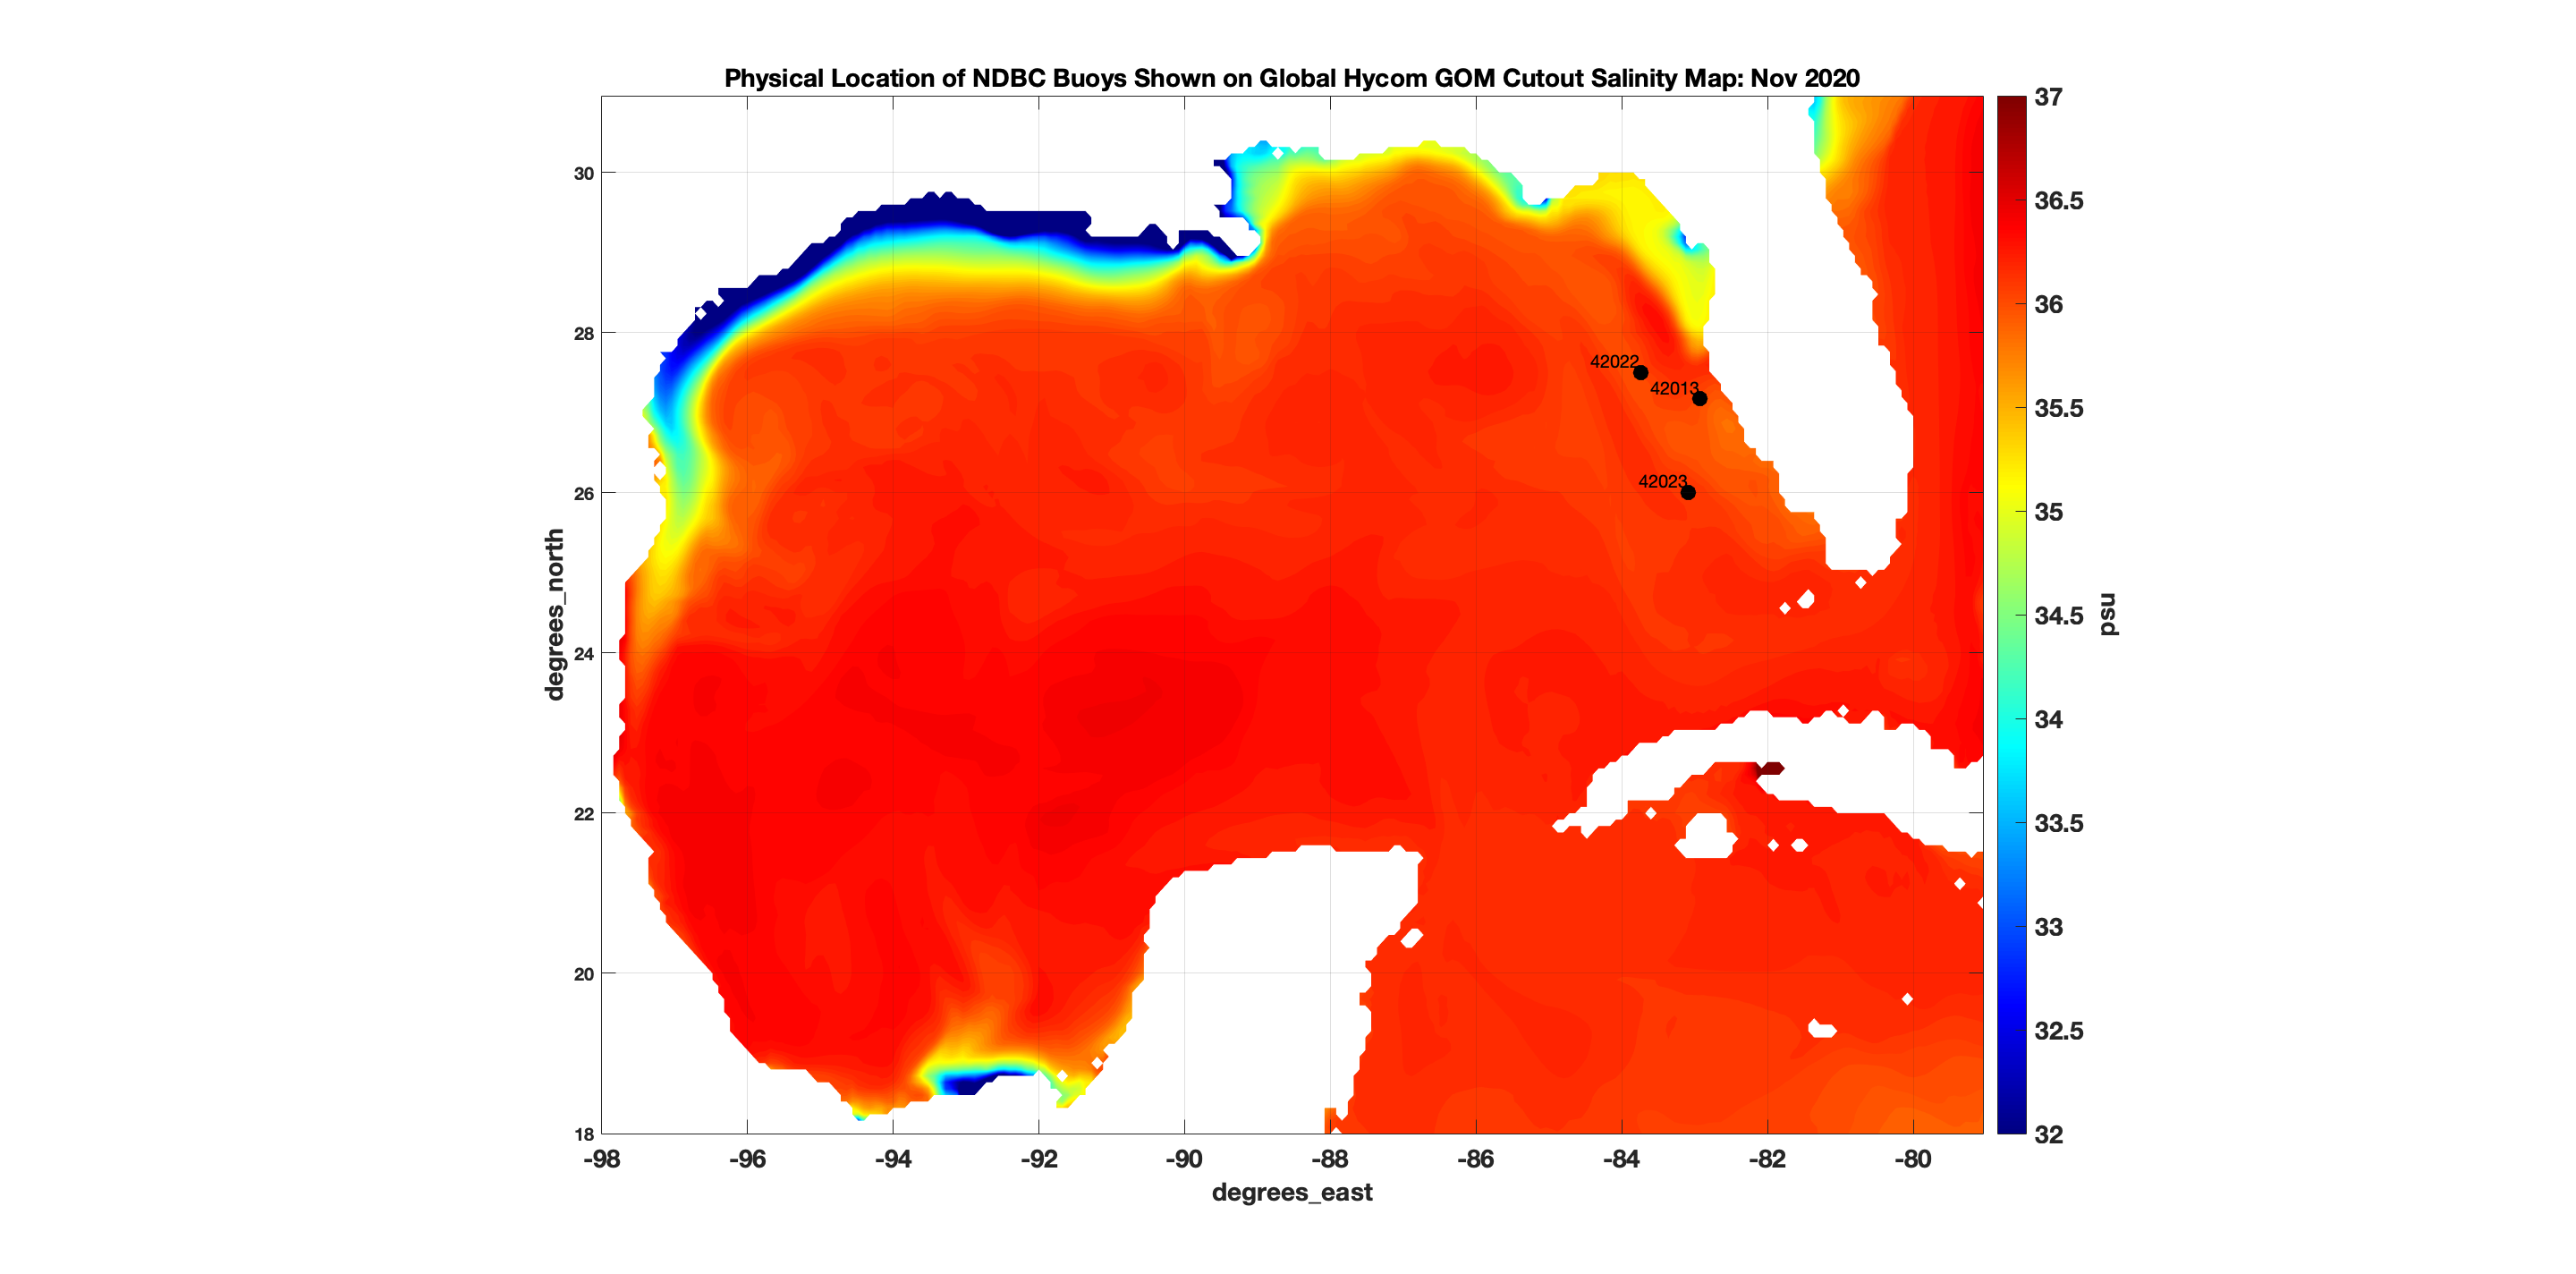
Comparing NDBC and Global Hycom in GOM for Years 1993-2020 |
|||
The plots below were created to help compare SSS data in the GOM for years 1993-2020 comping from various sources such as observational data from the National Data Buoy Center (NDBC) and Global Hybrid Coordinate Ocean Model (Global Hycom). These aid in understanding how well the sources compare allowing for a better knowledge of how well models are performing in comparison to observational and other model data. These plots include interpolated time series plots from monthly means as well as seasonal surface plots. There is also a reference plots to understand where the buoys are located. |
|||
|
|||
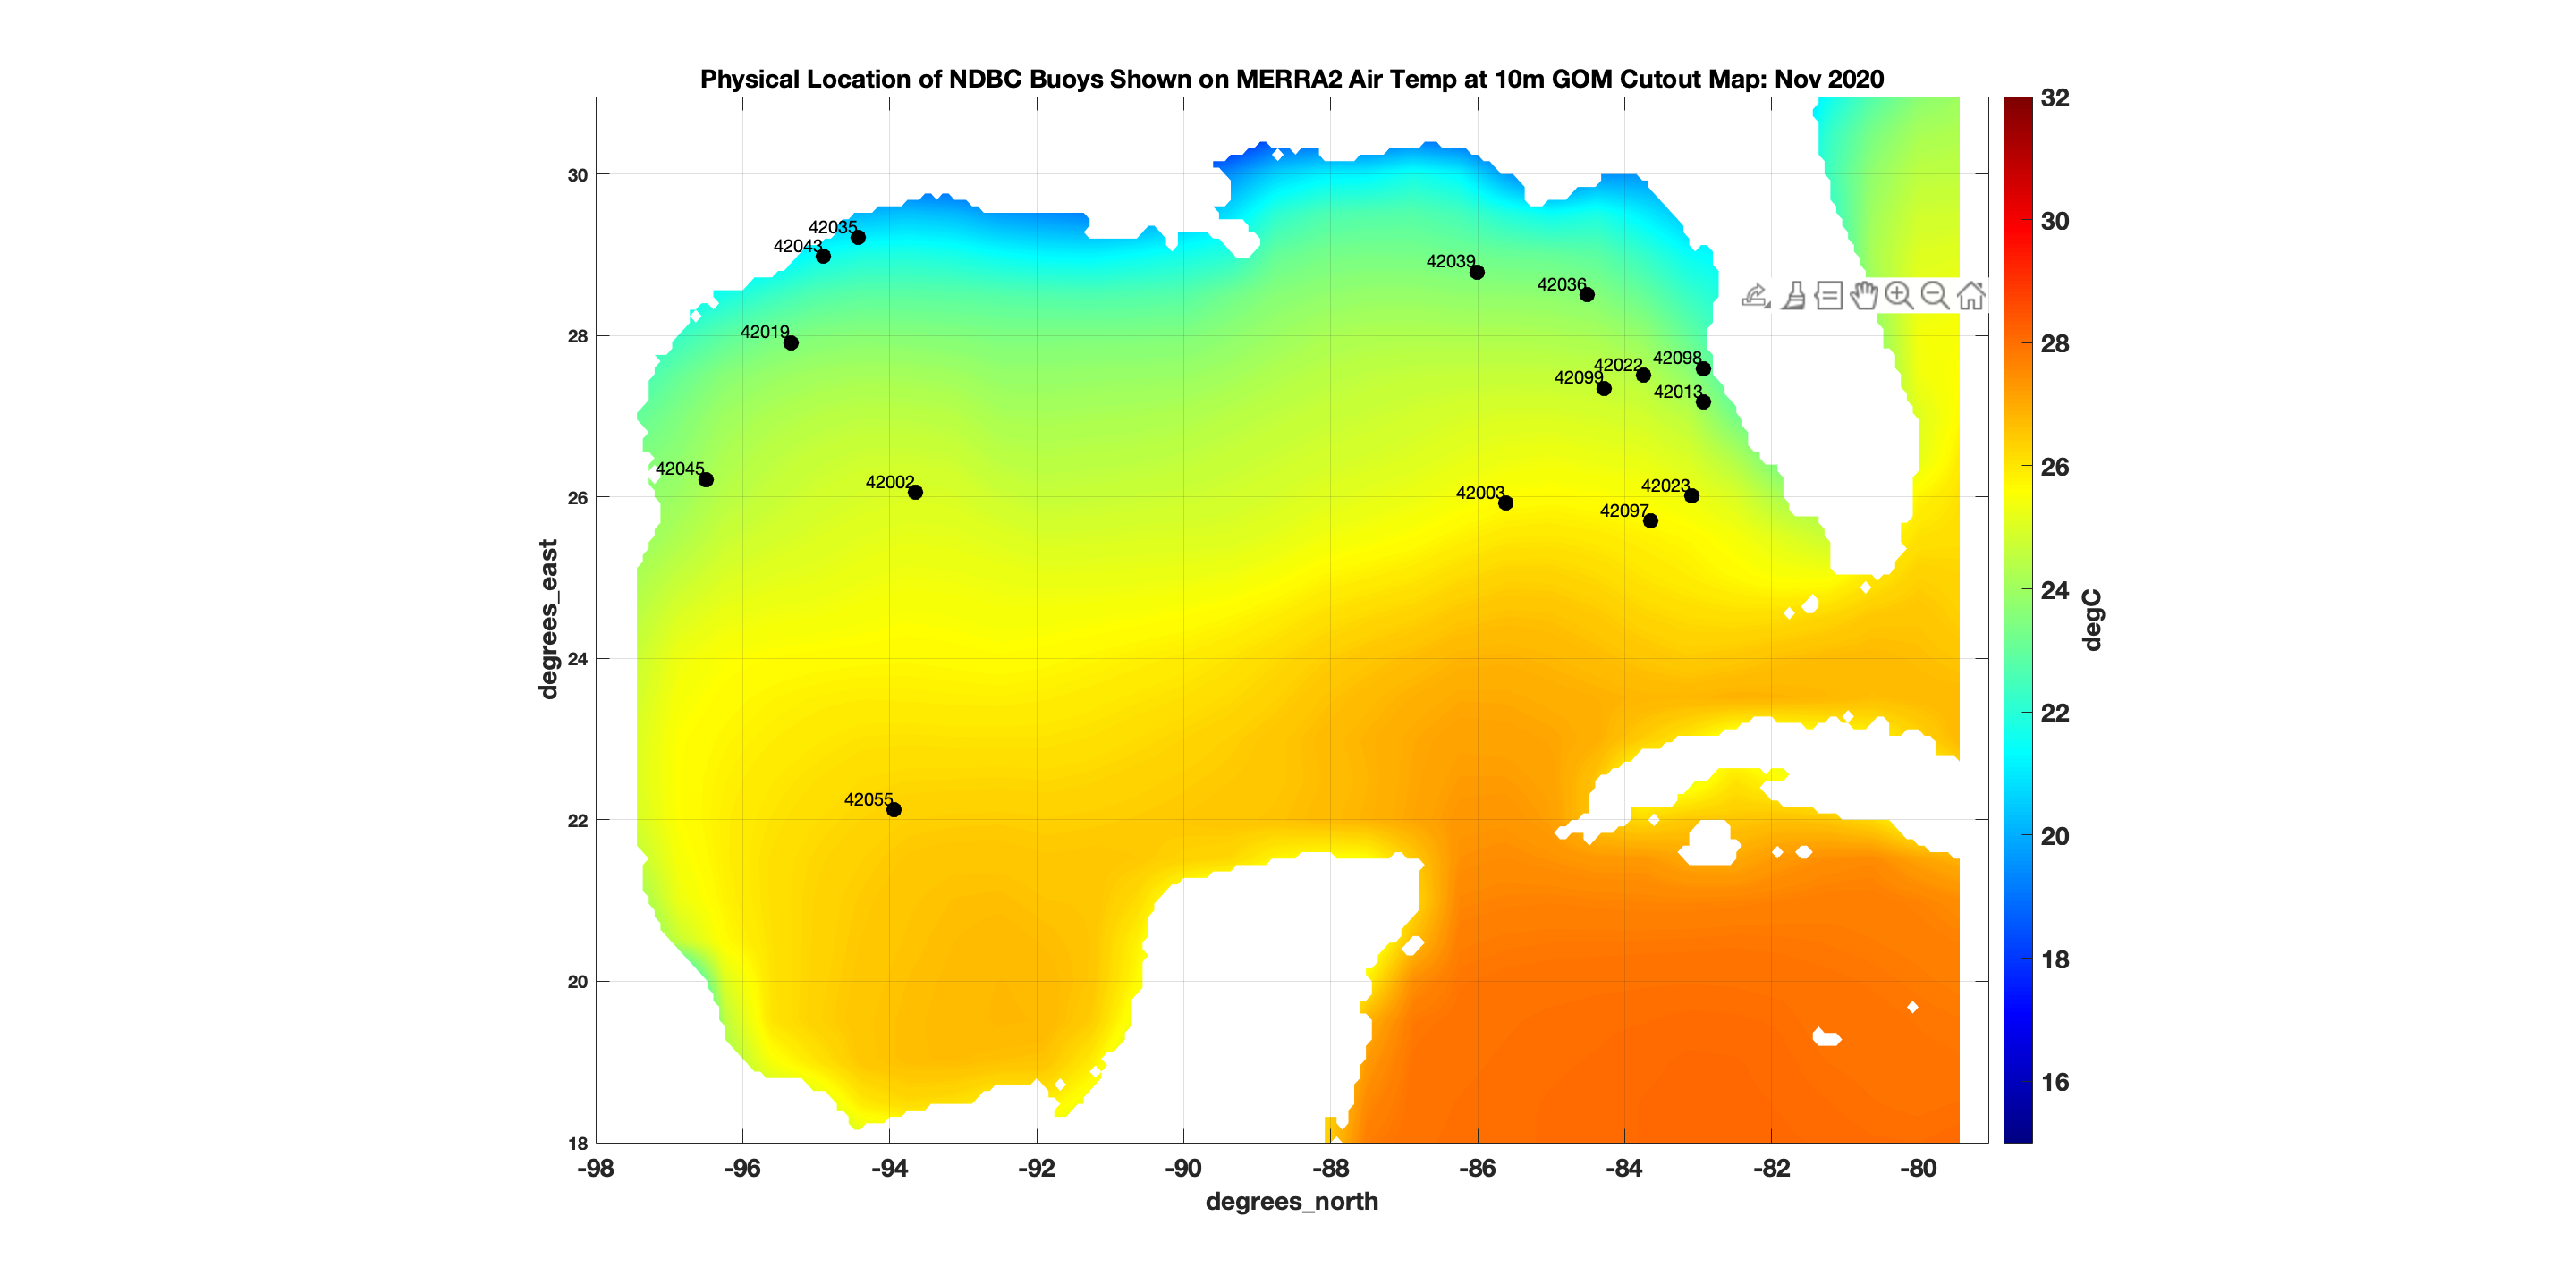
Comparing NDBC and MERRA2 in GOM for Years 1980-2020 |
|||
The plots below were created to help compare air temperature data in the GOM for years 1980-2020 comping from various sources such as observational data from the National Data Buoy Center (NDBC) and Modern-Era Retrospective analysis for Research and Applications, Version 2 (MERRA2). These aid in understanding how well the sources compare allowing for a better knowledge of how well models are performing in comparison to observational and other model data. These plots include interpolated time series plots as well as a reference plots to understand where the buoys are located. |
|||
|
|||
Comparing NDBC and Global HYCOM in GOM for Years 2006-2020 |
|||
The plots below were created to help compare ocean current data in the GOM for years 2006-2020 comping from various sources such as observational data from the National Data Buoy Center (NDBC) and Global Hybrid Coordinate Ocean Model (HYCOM). These aid in understanding how well the sources compare allowing for a better knowledge of how well models are performing in comparison to observational and other model data. These plots include interpolated time series plots as well as a reference plots to understand where the buoys are located. |
|||
|
|||
|
|||
BOEM Time Series Plots |
|||
The plots below were created to help compare SST trends in various regions of the GOM. The data includes Extended Reconstructed Sea Surface Temperature (ERSST) from 1980-2020, Modern-Era Retrospective analysis for Research and Applications - Version 2 (MERRA2) from 1980-2020, and GOM cutouts of Global Hybrid Coordinate Ocean Model (HYCOM) from 1993-2020. The time series are monthly means (green) and include a yearly average and trend (black), summer (June, July, August) average and trend (red), and winter (December, January, February) average and trend (blue). |
|||
|
|||
|
|||
|
The Naval Reasearch Laboratory - Stennis Space Center: 7330 Ocean Sciences "This is an official U.S. Navy web site." Please read the Privacy Policy. |
|||
Disclaimer: The results herein are derived from ongoing NRL research and development and are not considered "operational". Availability, service, or timely delivery of data are not guaranteed. |
|||
|
Points of Contact Sergio deRada Sydni Crain |
Last revised: 24-September-2021
|
||